• Home
  • Short articles
  • Publications
  • Financial Economics
  • Current Work
  • Teaching
  • Market Volatility
  • Media Clips
  • Contact
  • IT
  • EN
  • Home
  • Short articles
  • Publications
  • Financial Economics
  • Current Work
  • Teaching
  • Market Volatility
  • Media Clips
  • Contact
  • IT
  • EN

Short articles

Antonio Mele is a financial economist, a professor of Finance at USI and a Senior Chair at the Swiss Finance InstituteThis section contains a number of short writings on finance and economics and the interlinks with real developments. Some of these writings focus on brief summaries of Antonio’s recent academic research. Others suggest how this research may be interpreted in light of real market developments, past or current. This section also aims at hosting content that may hopefully stimulate academic research as well as broad debates on the role of finance and economics in our societies. The content herein should not be construed as providing the reader with any of Antonio Mele’s political views, professional advice or trading recommendations.

Briefly, Antonio is a financial economist, currently a Professor of Finance at USI (Università della Svizzera Italiana) and the Swiss Finance Institute, and a Research Fellow at the Center for Economic Policy Research (CEPR). Prior to this, he had been at the London School of Economics for ten years.

His interests cover a number of areas and mainly the volatility of capital markets, the linkages between financial markets and macroeconomic developments, and market microstructure. His work for the industry is at the basis of new real-time indicators of volatility in fixed income markets that are maintained by Chicago Board Options Exchange and S&P Dow Jones Indices as well as tradeable instruments to hedge against uncertainty in interest rate and credit markets.

Please visit the Homepage of this site for additional summary details on his activities and the supplementary sections for information on his research, teaching activities and work at the industry level.

Antonio Mele is a financial economist, a professor of Finance at USI and a Senior Chair at the Swiss Finance InstituteThis section contains a number of short writings on finance and economics and the interlinks with real developments. Some of these writings focus on brief summaries of Antonio’s recent academic research. Others suggest how this research may be interpreted in light of real market developments, past or current. This section also aims at hosting content that may hopefully stimulate academic research as well as broad debates on the role of finance and economics in our societies. The content herein should not be construed as providing the reader with any of Antonio Mele’s political views, professional advice or trading recommendations.

Briefly, Antonio is a financial economist, currently a Professor of Finance at USI (Università della Svizzera Italiana) and the Swiss Finance Institute, and a Research Fellow at the Center for Economic Policy Research (CEPR). Prior to this, he had been at the London School of Economics for ten years.

His interests cover a number of areas and mainly the volatility of capital markets, the linkages between financial markets and macroeconomic developments, and market microstructure. His work for the industry is at the basis of new real-time indicators of volatility in fixed income markets that are maintained by Chicago Board Options Exchange and S&P Dow Jones Indices as well as tradeable instruments to hedge against uncertainty in interest rate and credit markets.

Please visit the Homepage of this site for additional summary details on his activities and the supplementary sections for information on his research, teaching activities and work at the industry level.

News, short writings, and comments

May 14, 2020

Black swans and economic policy

Tags: Financial Volatility, Global Financial Crisis, National debt

(This short article relies on a post in Italian that I wrote with Renato Loiero on April 29th, 2020.)

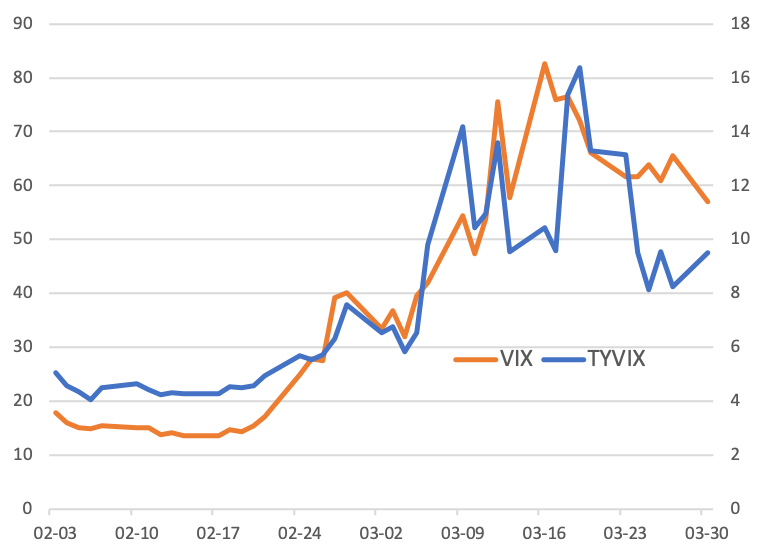
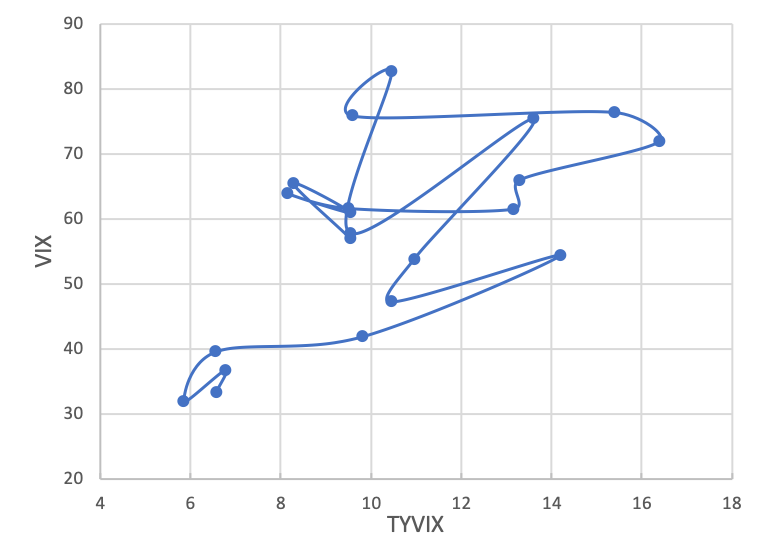
Market volatility has never been as high as during the outbreak of Covid-19. On March 16th, the VIX index maintained by maintained by Chicago Board Options Exchange (also known as the “fear index”) hit its record high of more than 82 percentage points. Market data such as future prices on VIX showed that the investors’ concerns about the economic effects of coronavirus were more acute and likely to persist more than during the 2007-2009 Global Financial Crisis.

The reasons underlying these developments are very clear. At the time, market evaluations were probably already very high. For example, the market was already complacent about the fact that the Federal Reserve would continue to pursue a policy with ultra-low interest rates. At the time, the only thing that would make you change your mind about market evaluations might have been the occurrence of a “Black Swan” event. Covid-19 was such an event. Its devastating effects on the economy were very clear since the beginning, with job losses reaching levels not seen since the Great Depression of the Thirties of the last century.

Market turmoil is always very worrying. When market volatility is high, investors sell. But when investors sell, market volatility raises further. This feedback loop certainly contributed to the complicated market dynamics that you observed in March and that I commented in a previous post. If, during these developments, some important financial institutions had to incur into a big loss, you would have witnessed to market dysfunctionalities reminiscent of the 2007-2009 Global Financial Crisis (notably, a credit crunch), with adverse consequences on an already seriously compromised real economy.

It is very reinsuring that, today, market volatility is much, much lower. At least, so it seems today, such additional spillovers will not happen. Uncertainty in financial markets and economic activity is much lower than two months ago.

Why? Economic policy around the world has certainly contributed to mitigate this uncertainty. Policy makers seem to have learnt the lessons from the Global Financial Crisis and the European Debt Crisis, injecting thousands of billion dollars into the economy throughout dedicated policy plans. Some of these plans were truly unprecedented. Certainly, humanity had to face several extremely challenging moments in the last ten or fifteen years: the Global Financial Crisis, the European Debt Crisis, migration problems, climate change problems, and, now, pandemic problems.

It is likely that, today, we will learn from these History lessons and react to the current developments with coherent policy plans. The fact that Europe is trying to come up with a common policy throughout a variety of projects shouldn’t be surprising. If Europe is a political project, it is very normal that its resolutions would reflect complex mediation mechanisms.

We should conclude and try to think positively. However, we need to think about the economic problems that we are about to experience soon. Covid-19 would leave humanity with a big debt burden. We shouldn’t worry too much about countries where public debt was relatively low before this crisis, such as Switzerland. We shouldn’t worry about other countries such as the United States. However, we would have to worry about some European countries, where public debt was already very high before the pandemic. This debt will have to be borne by the future generations: the more an economic system is oppressed with debt, the higher the efforts needed to be at the same level as countries with lower debt. From now on, economic development and re-construction will have to go hand in hand with financial stability. Therefore, let’s raise debt now (we have no choice), but let’s be prepared to manage its implications in the medium and long term.

Category: Financial stability

April 6, 2020

Volatility at the time of Covid-19

Tags: Fed, Feedback loops, Financial Volatility, TYVIX, VIX

Volatility at the time of Covid-19 has provided us with a vast number of unexpected and challenging facts. VIX and Treasury VIX (both maintained by Chicago Board Options Exchange: Cboe) averaged about 11 and 58 in March 2020 and hit levels not seen since the global financial crisis. Despite these movements, equity and Treasury volatilities have adjusted to news through different dynamics (see Figures 1 and 2).


Figure 1. Levels of Cboe VIX (equity) (left scale) and Cboe TYVIX (Treasury VIX) (right scale).


Figure 2. Evolution of VIX and TYVIX in March 2020.


Increased risk aversion first affected equity markets, with volatility and prices feeding on each other: falling prices would increase volatility, and increased volatility would trigger additional sales. This feedback loop led the Fed to dramatically decrease target rates (March 15th) and VIX to hit its record high of more than 82 on March 16th.  During the following days, VIX lowered by more than 20 percentage points as fiscal stimulus plans were elaborated and the Fed clarified the granular scope of its intervention.

Risk aversion then affected Treasury markets, with Treasury VIX touching its record high of more than 16. VIX and Treasury VIX would finally lower to their levels at the beginning of the month as markets incorporated resolution of uncertainty regarding the scope of policy actions.


PS: Let’s try to re-write history. Did VIX hit its record high due to the panic following the Fed action? My previous interpretation is that on the week prior to the Fed decision, a “general fear factor” was looming around, which led the Fed to decrease rates and market to panic (i.e., the Fed didn’t cause the surge in VIX). Alternatively, the Fed caused the surge in VIX. It may be the case, of course. It is very difficult to estimate what might have occurred without the Fed action. But, as noted, equity market volatility decreased again, overall, in the following week, while further details on policy actions were unveiled to the market.

Category: Market volatility

June 3, 2019

A theory of debt accumulation and deficit cycles

Tags: Austerity, Credit spreads, Fiscal tipping points, National debt

The issue: many advocate the thesis that a large government debt might hinder growth. For example, too much debt may signal upcoming tax increases, which discourages new investments. Do you remember Krugman v. Reinhart & Rogoff controversy? Reinhart & Rogoff theses seem to have influenced policymakers in the process of dealing with the European debt crisis of the early 2010s. In Reinhart and Rogoff own words:

"Our 2010 paper found that, over the long term, growth is about 1 percentage point lower when debt is 90 percent or more of gross domestic product."

Carmen M. Reinhart and Kenneth S. Rogoff, April 26, 2013, The New York Times

Do such numbers exist? Paul Krugman believes they don't. More recently, Alberto Alesina, Carlo Favero and Francesco Giavazzi have contributed to shift the debate on how to cure debt-sickness in their book on Austerity: When It Works and When It Doesn’t (2019, Princeton University Press). To cut a long story, the authors argue that austerity programs relying on cutting expenses are less painful and, sometimes, even expansionary, than austerity plans relying on increasing taxes.

I ask a related question. Too much debt might lead to default, and austerity plans might be unavoidable at some point. When? In a recent research paper, I argue that when governments have a "deficit bias," such austerity plans might arrive too late to avert a crisis.

Slides are here.

Paper is here.

Category: Finance and macroeconomics

May 30, 2019

The art of art analytics

Tags: Art pricing models, Art-tech, Artificial intelligence, Big data analytics, Bubbles, Fin-tech, Hedonic models, Relative value trading

How do we evaluate art? Can we use big data and artificial intelligence to price one of the “Tagli di Fontana” or a piece of Kusama? How do we determine whether a certain artist is overpriced? Please consider the picture below.

Figure 1

First things first. What is fundamental and what is irrational about asset evaluation? How do we identify whether an asset is in a bubble? When do bubbles burst? Financial economists have been debating these issues for decades. The outcome is a set of sophisticated analytical tools at the heart of algorithmic trading strategies. Discovering a nascent or a fading bubble has simple trading implications. Equally important is relative evaluation in a given asset class: which assets in this class are undervalued or overvalued? A long-short strategy (buy the cheap, sell the rich) would help investors regardless of the direction of the bubble. But, how do we know whether an asset is undervalued? Modeling relative value is an art, and the tools in this space may be quite sophisticated.

We may make use of comparable analytics in the fascinating art space, a space governed by amazing regularities despite the obvious unpredictable traits that underlie creative work. First, one would need to identify general trends in market evaluations for a given artist. One would, then, need to collect transaction data on this artist and extract general trends in these data, in spite of the unavoidable heterogeneity in the artist's creations. Admittedly, though, this task might be expensive. Data vendors might require hundreds of thousand dollars subscription per year for having access to their unstructured data.

Figure 1 depicts an index of market evaluations that I have created for Yayoi Kusama, a celebrated Japanese artist. The index equals 100 in the first year for which we record transactions; the index, then, evolves over time, going up or down according to the average price direction in the universe of Kusama’s artworks over time.

The method of index construction is instructive. The methodology enables one to extract common trends in the artist’s artworks while also supplying tentative predictions of the value of each single artwork in the index universe through an approach known as “hedonic.” Consider Figure 2. Its left panel depicts the index values of Figure 1. The right panel depicts, instead, the price of sold artworks (i.e., observed prices) against the price of artworks predicted by the model. Shown in this right panel is also the 45-degree line, in red.

Figure 2

If the model were able to predict prices without errors, the blue circles would all lie on the red line. Alternatively, and in an idealized world in which the model holds perfectly, the points below the red line identify artworks that are cheap. The model, then, delivers an assessment of relative value. If we were allowed to sell short, we could implement a long-short strategy, selling the artworks identified by the circles above the red line, and buying the artworks identified by the circles below the red line. In practice, the model is only an approximation of the subtle market mechanisms underlying Kusama’s creations, and such trades are risky. Still, the model provides us with a useful trading recommendation that may complement traditional advice in this space.

Art analytics might truly help us understand art evaluations. An art-tech company might then have to resemble a fin-tech. Its dedicated team would have to aim at developing methods and processes to analyze artworks' data for the purpose of indexing and pricing. Its data scientists, mathematicians and economists would have to dialogue with art experts and improve the provision of information and implement tasks such as:

  • Creation of a trading platform. Would need find regulatory clearance: not a trivial task.
  • Developing automatic index feeds and displays on the platform.
  • Provision of bespoke indexing and pricing services to UHNWI, such as portfolio selection, financial advice, trading recommendations.
  • Developing hedonic pricing algorithms comprising art expert categorical variables: the antecedent to big data analytics.
  • Designing financial products centered on artwork indices.
  • Contributing to mechanism design regarding pricing and trading protocols.
  • Designing listable products.

At the moment, these tasks seem to belong to science-fiction or, to remain on the theme, art-fiction...

Category: Asset evaluation

May 28, 2019

Playing with fire (and national debt)

Tags: Default, Fiscal reforms, Parameter uncertainty, Spread

Fun ways to play with fire ... It may take a small prediction error on how primary deficits affect GDP dynamics to trigger a “diabolic” spread-debt spiral. The graph below contains some simulations taken from a paper of mine (“A Theory of Debt Accumulation and Deficit Cycles”).

Define the spread curve as the relation between the debt-to-GDP ratio of a country and the spread over a riskless security that the markets require to invest into the national debt of that country. The blue curve is the spread curve in an economy with low growth. The red curves are the spread curves in economies with more deficits; the solid line results when a higher deficit improves GDP growth; the dashed line results in the unlucky circumstance where more deficits have no effect on growth. With a debt-to-GDP ratio at about 130%, a reform that goes the wrong way might rapidly lead a country to experience extreme spreads-debt dunamics.

It doesn't mean that primary deficits lead to default! But when the debt-to-GDP ratio is high, extreme caution would need to be exercised while deciding upon the nature and extent of a deficit.

Category: Financial stability

  • Recent Posts

    • Black swans and economic policy

      14 May 2020
    • Volatility at the time of Covid-19

      6 April 2020
    • A theory of debt accumulation and deficit cycles

      3 June 2019
    • The art of art analytics

      30 May 2019
    • Playing with fire (and national debt)

      28 May 2019
  • ALL POSTS
  • Archives

    • May 2020
    • April 2020
    • June 2019
    • May 2019


  • Recent Posts

    • Black swans and economic policy

      14 May 2020
    • Volatility at the time of Covid-19

      6 April 2020
    • A theory of debt accumulation and deficit cycles

      3 June 2019
  • –

  • –

  • Information

    • Home
    • Contact
    • T
    • Y
    • L
  • –

  • –

    • IT
    • EN

© Copyright 2011 – 2025 Antonio Mele