

Volatility at the time of Covid-19 has provided us with a vast number of unexpected and challenging facts. VIX and Treasury VIX (both maintained by Chicago Board Options Exchange: Cboe) averaged about 11 and 58 in March 2020 and hit levels not seen since the global financial crisis. Despite these movements, equity and Treasury volatilities have adjusted to news through different dynamics (see Figures 1 and 2).
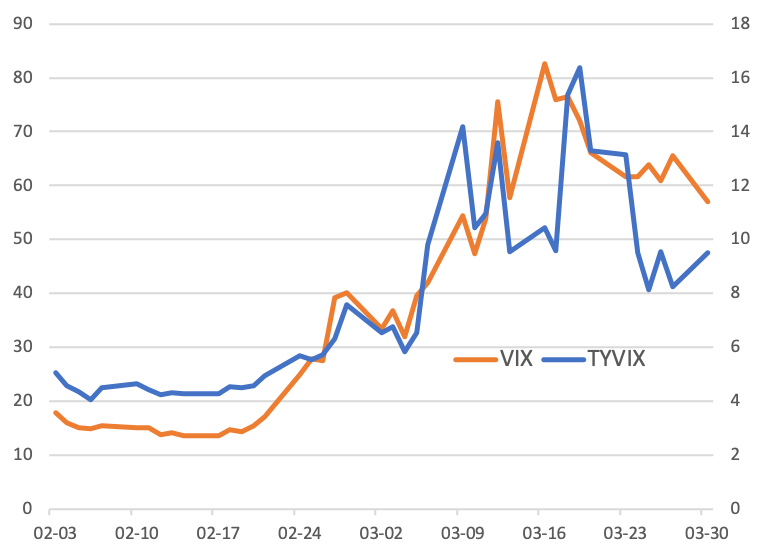
Figure 1. Levels of Cboe VIX (equity) (left scale) and Cboe TYVIX (Treasury VIX) (right scale).
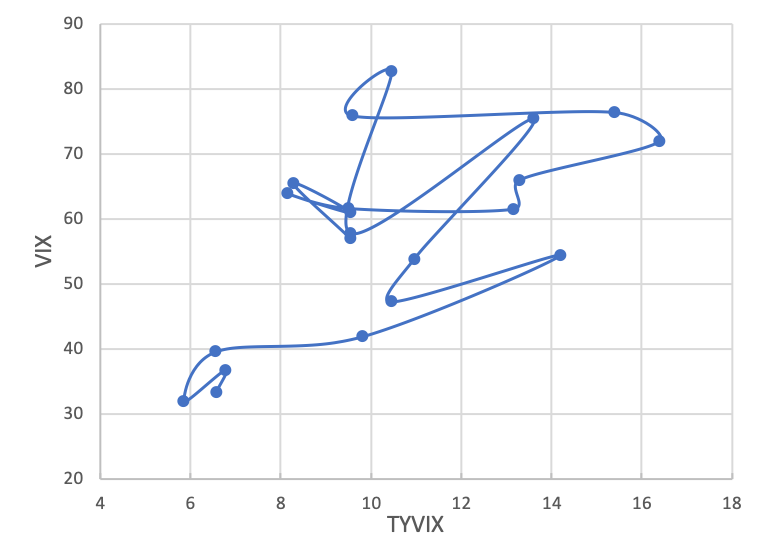
Figure 2. Evolution of VIX and TYVIX in March 2020.
Increased risk aversion first affected equity markets, with volatility and prices feeding on each other: falling prices would increase volatility, and increased volatility would trigger additional sales. This feedback loop led the Fed to dramatically decrease target rates (March 15th) and VIX to hit its record high of more than 82 on March 16th. During the following days, VIX lowered by more than 20 percentage points as fiscal stimulus plans were elaborated and the Fed clarified the granular scope of its intervention.
Risk aversion then affected Treasury markets, with Treasury VIX touching its record high of more than 16. VIX and Treasury VIX would finally lower to their levels at the beginning of the month as markets incorporated resolution of uncertainty regarding the scope of policy actions.
PS: Let’s try to re-write history. Did VIX hit its record high due to the panic following the Fed action? My previous interpretation is that on the week prior to the Fed decision, a “general fear factor” was looming around, which led the Fed to decrease rates and market to panic (i.e., the Fed didn’t cause the surge in VIX). Alternatively, the Fed caused the surge in VIX. It may be the case, of course. It is very difficult to estimate what might have occurred without the Fed action. But, as noted, equity market volatility decreased again, overall, in the following week, while further details on policy actions were unveiled to the market.