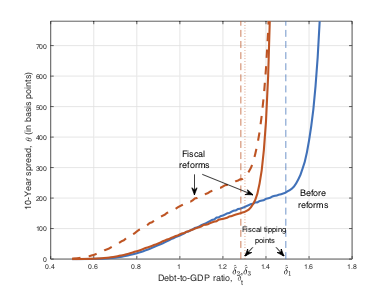
Fun ways to play with fire … It may take a small prediction error on how primary deficits affect GDP dynamics to trigger a “diabolic” spread-debt spiral. The graph below contains some simulations taken from a paper of mine (“A Theory of Debt Accumulation and Deficit Cycles”).

Define the spread curve as the relation between the debt-to-GDP ratio of a country and the spread over a riskless security that the markets require to invest into the national debt of that country. The blue curve is the spread curve in an economy with low growth. The red curves are the spread curves in economies with more deficits; the solid line results when a higher deficit improves GDP growth; the dashed line results in the unlucky circumstance where more deficits have no effect on growth. With a debt-to-GDP ratio at about 130%, a reform that goes the wrong way might rapidly lead a country to experience extreme spreads-debt dunamics.
It doesn’t mean that primary deficits lead to default! But when the debt-to-GDP ratio is high, extreme caution would need to be exercised while deciding upon the nature and extent of a deficit.