

A PDF article-style version of this page, including figures and references, is available for download.
Download the PDF article-style version of this page
Suggested citation: Antonio Mele: “Market Volatility: From Equity to Interest Rate and Credit Markets.” June 2025. Available at: https://www.antoniomele.org/market-volatility/.
Uncertainty and volatility in financial markets
Why has financial volatility become such a central concern today? For decades, particularly during the Great Moderation (1982-2007), it remained a niche topic mostly confined to financial economists. Macroeconomists, policymakers, and geopolitical analysts typically regarded it as peripheral to the dynamics of growth, inflation, or international policy coordination. The Global Financial Crisis fundamentally altered that view, revealing just how central volatility can be to the broader functioning of the economy. And indeed, there are compelling economic reasons to care. For instance, real options theory predicts that heightened uncertainty leads firms to delay investment and hiring decisions. In such environments, even potentially profitable projects may be postponed, slowing down economic activity and amplifying cyclical downturns. As illustrated in Figure 1, a one-standard-deviation increase in a common indicator of financial uncertainty—the VIX Index—elicits a significant and persistent response in U.S. unemployment. (To put this into perspective, a one-standard-deviation move in the VIX corresponds to approximately 7 percentage points, while a one-standard-deviation change in unemployment is around 2%.)
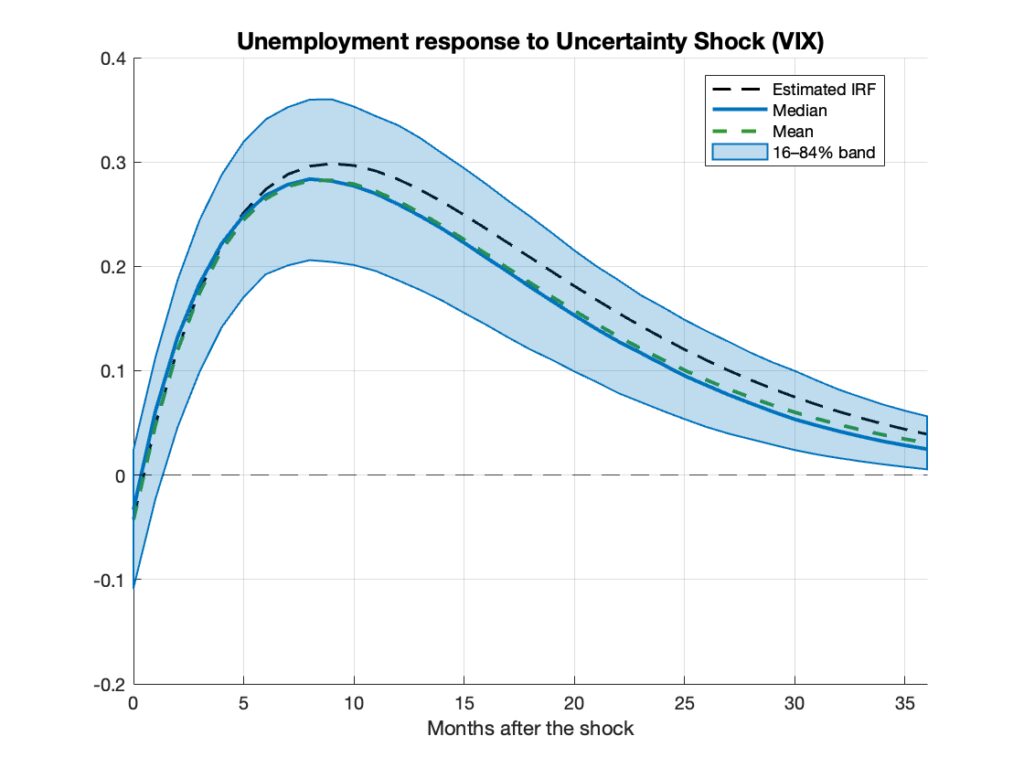 Figure 1: Response of the U.S. unemployment rate to a one-standard-deviation shock to the Cboe VIX Index, as predicted by a Structural VAR model. Confidence bands and related statistics are obtained via bootstrap procedures. Sample period: January 1990 to February 2025 (monthly data). Data—sourced from FRED—and replication code are available upon request.
Indeed, one of the most significant advances in financial economics in recent decades has been the development of tools to measure the uncertainty expected to arise in capital markets. The most well-known of these instruments is the VIX index—used in Figure 1—maintained by Chicago Board Options Exchange (Cboe), which gained widespread public attention during the Global Financial Crisis of the late 2000s.
Figure 2 (top panel) illustrates the time series behavior of this index. The index fluctuates around 18%, seemingly providing little significant information most of the time. However, it spikes around critical events—at times quite dramatically—such as during the Global Financial Crisis of the late 2000s. When it rains, it pours!
The bottom panel of this figure plots the average trading volume of financial products linked to the VIX, which became available for trading in the early to mid-2000s. Volumes did not pick up immediately. Perhaps it took time because only the dramatic events of the Global Financial Crisis motivated investors to trade products designed to protect against uncertainty. Or perhaps it took time because the widespread fears of the time extended to trading something new, including—paradoxically—instruments meant to hedge against uncertainty. We will likely never know.
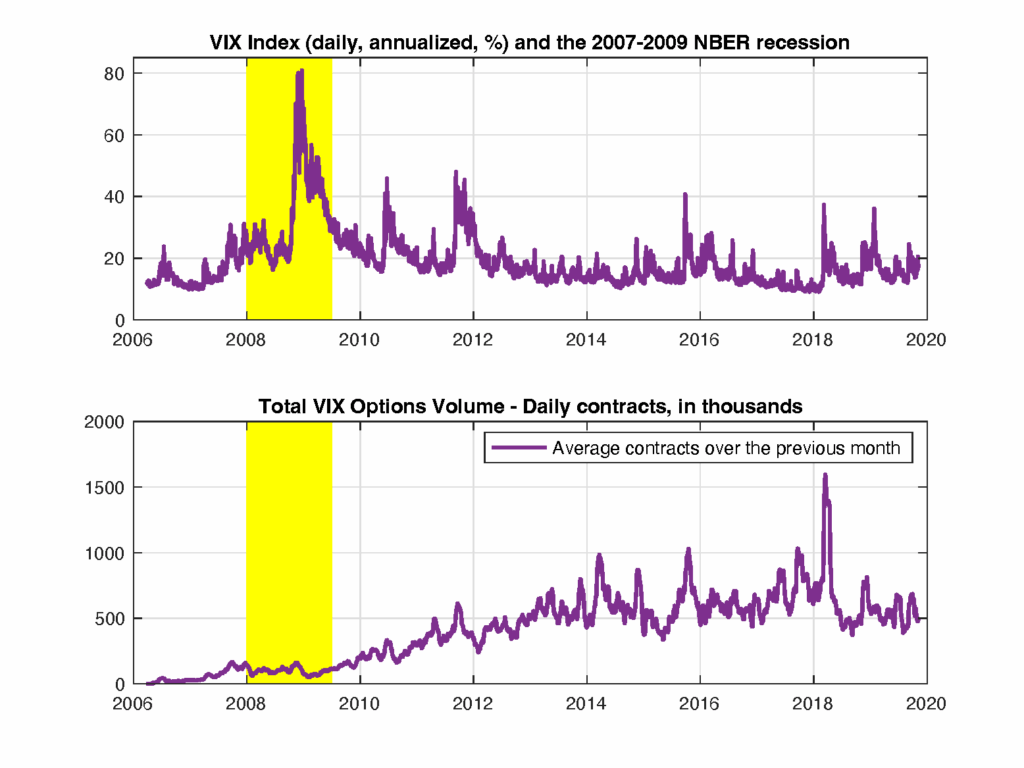 Figure 2: Cboe VIX Index (top panel) and volume of VIX derivatives (bottom).
While the VIX index is widely recognized as the benchmark for expected volatility in the U.S. equity market, interest rate and credit markets represent some of the largest segments of the global capital markets. In the 2010s, Yoshiki Obayashi and I collaborated with Cboe to develop a suite of indices designed to measure expected volatility across various interest rate and credit markets, including interest rate swaps, government bonds, and corporate credit.
Let us explain the context.
Measuring expected volatility
Volatility reflects uncertainty in security price movements, regardless of whether those movements trend upward or downward. What truly defines volatility is not the direction of price changes but rather the magnitude of expected future price fluctuations.
For many market participants, volatility poses a significant concern. However, old hedging instruments, such as portfolios of derivatives (e.g., straddles), are often insufficient for effectively managing this risk. These instruments suffer from what is known as price dependence—a feature that causes their returns to reflect both volatility and the direction of price movements. Ideally, however, a volatility hedge should isolate exposure to volatility alone, without incorporating directional risk.
In theory, this issue can be addressed by constructing a portfolio composed of a large number of derivatives that pay off during extreme price movements—so called out-of-the-money options. The breakthrough in this area came in 1999 when a Goldman Sachs research team derived the precise mathematical weights that such derivatives must carry in a portfolio to serve as perfect volatility hedge (see Demeterfi, Derman, Kamal and Zou, 1999).
These results formed the basis of the VIX index.
The price of uncertainty
How does the VIX relate to the monetary cost required to mitigate uncertainty? Suppose that you and I decide to exchange, for money, the level of uncertainty that is expected to arise in the equity market over a future period. Uncertainty is a complex concept, but we can attempt to operationalize this idea through a type of contract known as a variance swap. The arbitrage-free price of a variance swap is the expectation of future security price uncertainty—typically, over one month—measured by its variance and adjusted for risk through a premium that compensates for the uncertainty surrounding this variance. Thus, by design, this price for uncertainty is forward looking. Its formula is given by:

where M is the time horizon over which future uncertainty is considered (e.g., one month, M=1/12);
![]() is the price at time t of an equity (either at-the-money or out-of-the money) option struck at
is the price at time t of an equity (either at-the-money or out-of-the money) option struck at
This formula possesses an extraordinary elegance: it is model-free, relying solely on option prices and standard assumptions such as Brownian motion information and absence of arbitrage. Its elegance lies in the surprising fact that, while uncertainty itself is not a traded risk, no risk premium appears in the formula. Note that standard asset pricing theory would instead suggest that pricing a derivative on an untraded risk (such as a variance swap) should require a model-dependent premium. Here, however, such premiums are already embedded in the prices of the options that determine the index.
I provide extensive conceptual and practical details on these issues in Chapter 11 of Financial Economics (Mele, 2022). Mele and Obayashi’s Price of Fixed Income Markets Volatility (2015) offers further insights into pricing uncertainty in interest rate and credit markets. I now turn to discussing foundational aspects of volatility in these segments. At the end of this page, you will find reference to both these materials and additional research I performed with my co-authors on interest rate and credit volatility.
Uncertainty in interest rate and credit markets
The standard VIX methodology cannot be directly employed to deal with the many intricacies arising in the interest rate and credit markets. These markets exhibit significantly greater complexity, and developing an innovative approach in this space requires addressing several new methodological challenges.
To begin with, these markets operate under different quoting conventions. To illustrate, market participants prefer to think in terms of absolute rather than relative changes in interest rates. This makes sense: a rate increase from 10 to 15 basis points represents the same percentage change as one from 100 to 150 basis points, yet the latter results in a tenfold difference in P&L and risk exposure. By contrast, the VIX in [1] measures the expected volatility of asset returns (i.e., relative changes).
What is needed, then, is a notion of volatility expressed in basis points. Mele & Obayashi’s (2011) United States Patent No.: US 8,510,210 B1 provides the mathematical expression for the expected interest rate volatility that captures this notion. Its formula is given by:

where M is the time horizon for future uncertainty; ![]() is the price at time t of an interest rate option (either at-the-money or out-of-the money) struck at
is the price at time t of an interest rate option (either at-the-money or out-of-the money) struck at ![]() and maturing at M; T is the maturity of the asset underlying these options;
and maturing at M; T is the maturity of the asset underlying these options; ![]() is the spacing between two consecutive strikes. The options underlying [2], while highly liquid, may be traded over the counter. Typically, this index is expressed in annualized terms.
is the spacing between two consecutive strikes. The options underlying [2], while highly liquid, may be traded over the counter. Typically, this index is expressed in annualized terms.
As with the VIX, this formula is model-free, relying solely on options (and the market numéraire, a concept to be recalled shortly). However, it differs from the VIX in several key respects.
First, and remarkably, the weighting scheme is astonishingly simple: each option receives the same weight. As a result, the squared index is roughly proportional to the sum of all option prices. This feature enables us to view IR-VIX as a basis point volatility index.
Second, this sum is rescaled by the inverse of ![]() , the market numéraire—a crucial concept. Let’s delve deeper. In frictionless markets, absence of arbitrage guarantees the existence of a unit of account under which all security prices are martingales relative to a specific probability—the market probability. We call this unit of account a numéraire in deference to Walras (1874), who noted that in general equilibrium, any commodity’s price can serve as a reference for expressing all others. In our context, numéraires serve to streamline the process of risk adjustment and pricing. This role is particularly significant in interest rate and credit markets, where the complexity of instruments often demands a distinct numéraire for each risk dimension. The formula in [2] is highly general: it can be applied to measure expected basis point volatility across these markets, each described by its numéraire. To put this into perspective, Mele & Obayashi (2011) applied this formula to evaluate interest rate swap (IRS) volatility, where the numéraire turns out to be the so-called Price Value of a Basis Point (PVBP)—the value of a basket of zero-coupon bonds that mature on the IRS reset dates. Furthermore, the formula can be used to assess credit volatility, where the numéraire is the so-called Defaultable PVBP (see below). Note, in passing, that these properties also explain the presence of
, the market numéraire—a crucial concept. Let’s delve deeper. In frictionless markets, absence of arbitrage guarantees the existence of a unit of account under which all security prices are martingales relative to a specific probability—the market probability. We call this unit of account a numéraire in deference to Walras (1874), who noted that in general equilibrium, any commodity’s price can serve as a reference for expressing all others. In our context, numéraires serve to streamline the process of risk adjustment and pricing. This role is particularly significant in interest rate and credit markets, where the complexity of instruments often demands a distinct numéraire for each risk dimension. The formula in [2] is highly general: it can be applied to measure expected basis point volatility across these markets, each described by its numéraire. To put this into perspective, Mele & Obayashi (2011) applied this formula to evaluate interest rate swap (IRS) volatility, where the numéraire turns out to be the so-called Price Value of a Basis Point (PVBP)—the value of a basket of zero-coupon bonds that mature on the IRS reset dates. Furthermore, the formula can be used to assess credit volatility, where the numéraire is the so-called Defaultable PVBP (see below). Note, in passing, that these properties also explain the presence of ![]() in the VIX formula [1]—the risk-free bond serves as the numéraire in the equity space.
in the VIX formula [1]—the risk-free bond serves as the numéraire in the equity space.
Third, this formula applies regardless of whether security prices are assumed to be continuous. Interest rates may experience discontinuous changes, as in Poisson processes, yet the previous formula remains the same. This is not the case with the VIX formula [1].
In 2012, Cboe introduced the first interest rate volatility index based on this methodology with the launch of the SRVIX Index of Interest Rate Swap Volatility—the first-ever volatility index in the fixed income space maintained by an exchange with the previous key properties: model-free and basis point-based. The index was fueled by real-time feeds of implied lognormal volatility data from top inter-dealer brokers in the USD swaption market (see FAQ and fact sheet). These brokers updated their volatility cubes (maturity, tenor, implied volatility) throughout each trading day based on observed trading flows between major sell-side dealers. The index was discontinued by Cboe in 2022 and has been maintained by Parameta Solutions ICAP since 2023 in the EUR and GBP interest rate swap markets (see fact sheet).
Figure 3 displays a selected sample of the Cboe SRVIX Index, calculated for the three-month forward rate with a 10-year underlying tenor. Figure 4 presents the full historical sample of the SRVIX Index, as originally produced by Cboe, calculated for the one-year forward rate with the same 10-year tenor. Both figures report confidence bands containing plausible future values of forward rates, constructed using the two indices: the higher the value of these interest rate volatility indices, the greater the uncertainty associated with future interest rate levels.
 Figure 3: Cboe Index of Interest Rate Volatility on a forward rate with 3-month maturity and 10-year tenor (top panel) and index-based forward swap rate confidence bands (bottom panel).
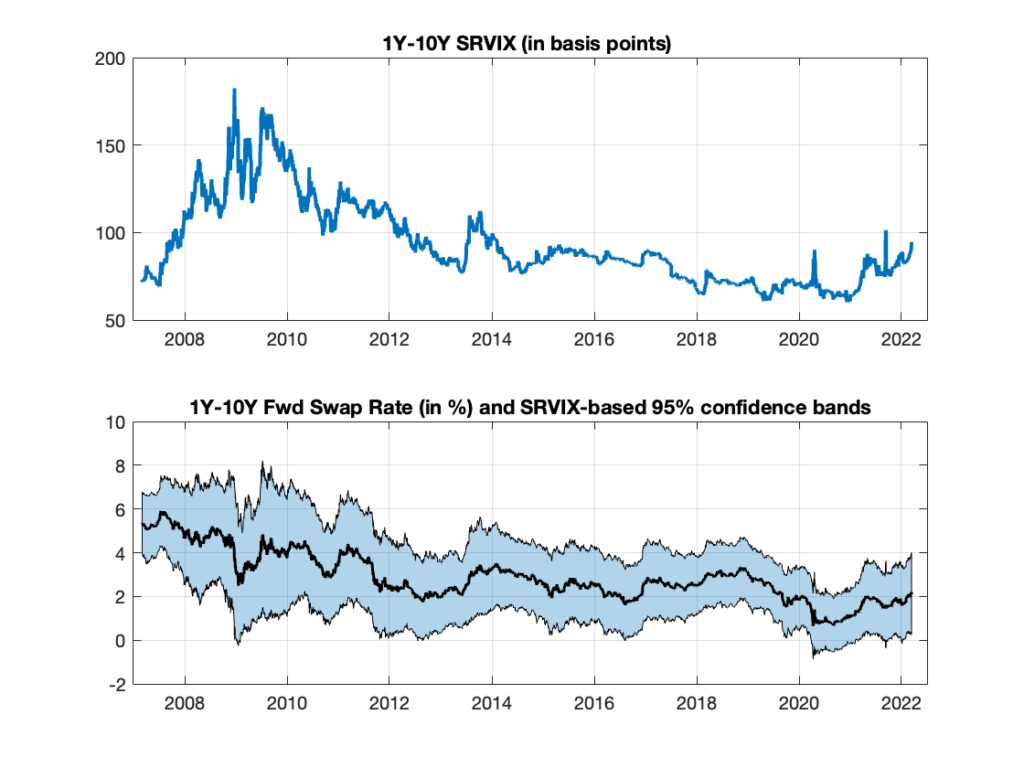 Figure 4: Cboe Index of Interest Rate Volatility on a forward rate with 1-year maturity and 10-year tenor (top panel) and index-based forward swap rate confidence bands (bottom panel).
The rationale behind the confidence bands in Figures 3 and 4 is the following. Theoretically, the square index in [2] is proportional to the expected value of basis point variance, defined as ![]() , where
, where
But does this uncertainty tell us anything about the real economy—about how people feel and form expectations on Main Street? That is, how does financial uncertainty in financial markets relate to expectations formed in the broader, real economy? Distaso, Corradi, and Mele (2013), as well as Distaso, Mele, and Vilkov (2024), have observed that long-run movements in stock market fluctuations and correlation risk in stock returns—two distinctly “Wall Street” phenomena—are indeed remarkably linked to the University of Michigan Index of Consumer Sentiment. This “Main Street” indicator is known to reflect fluctuations in consumer confidence, that is, individuals’ subjective assessments of their personal financial situation and broader economic conditions. While the VIX and SRVIX indices are only moderately correlated (approximately 50%), Figure 5 informally illustrates that both exhibit a meaningful relation with this measure of Main Street sentiment. It is indeed striking how closely the perceptions of individuals in the real economy align with the expectations embedded in the behavior of sophisticated option traders (as encapsulated by the volatility indices). This empirical link suggests that measures of uncertainty based on financial derivative data may reflect more than market dynamics: they may also encode how the broader public processes risk, expectations, and the economic outlook.
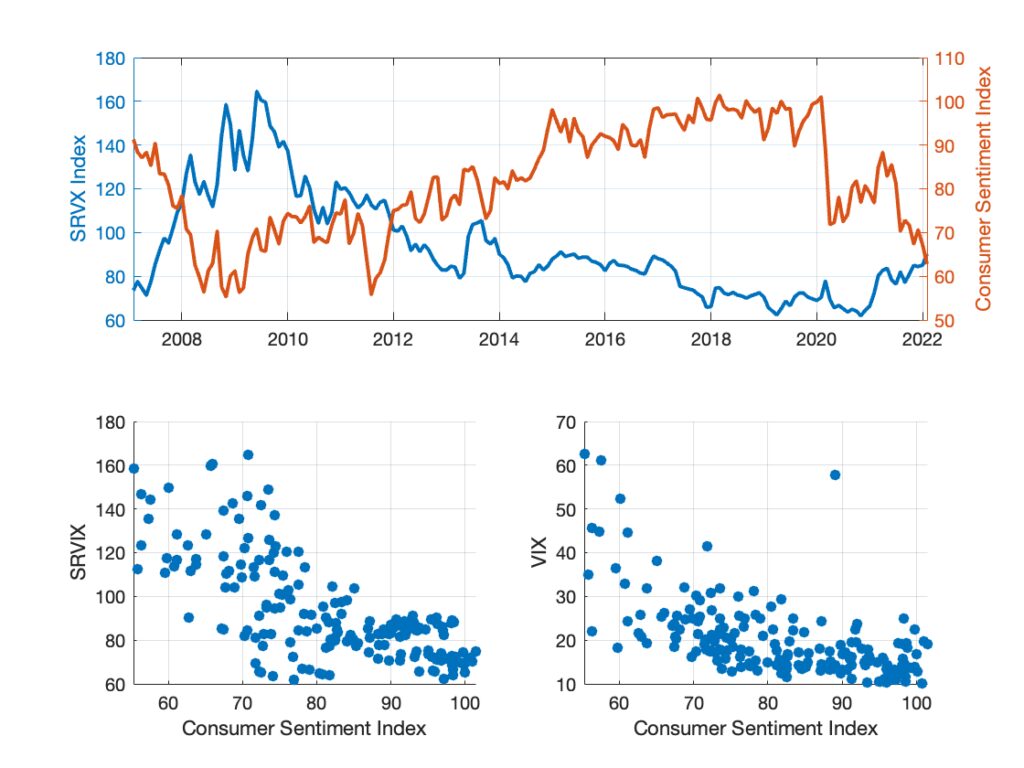 Figure 5: Sentiment and uncertainty (equity and swap spaces). Top panel: Cboe Index of Interest Rate Volatility (SRVIX on a forward rate with 1-year maturity and 10-year tenor) and the University of Michigan Consumer Sentiment Index. Bottom panel: scatterplots of SRVX and VIX index against Consumer Sentiment Index.
Later on this page, I will return to a detailed discussion regarding how [2] is used to measure expected volatility in the corporate credit markets.
Sovereign debt volatility
While swaption markets provide precise measures of basis point volatility linked to swap rates, they capture only one facet of uncertainty in fixed income markets. By contrast, sovereign bond markets are directly exposed to policy uncertainty, fiscal dynamics, and funding risk—factors that drive both pricing and volatility across global rates markets. Despite the growing relevance of these drivers, no standardized instruments existed to measure forward-looking volatility in sovereign bond markets until 2013. The absence of such benchmarks represented a material gap for both market participants and policymakers, especially as sovereign debt ratios expanded and monetary policy frameworks became more entangled with fiscal policy and financial stability mandates.
In 2013, Cboe filled this analytical void by launching the first standardized Treasury volatility index, based on a methodology that builds on simplified versions of work later published in Mele and Obayashi (2015, Chapter 4). These simplifications will be discussed below. Figures 6-7 depict the behavior of two Treasury volatility indices launched by Cboe—TYVIX and VXTLT—which represent the earliest attempts to measure forward-looking volatility in U.S. Treasury markets. Both were constructed following the aforementioned methodology and proposals, whose origins are further outlined below.
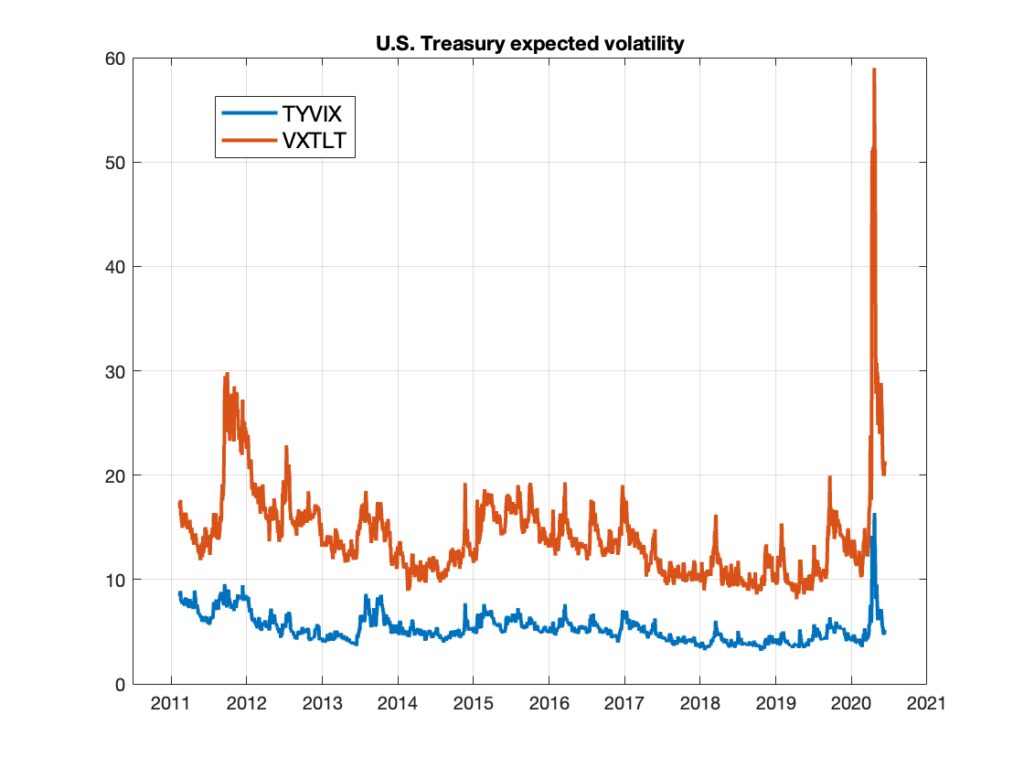 Figure 6: Treasury market expected volatility measured by Cboe TYVIX (discontinued in 2020) and Cboe VXTLT.
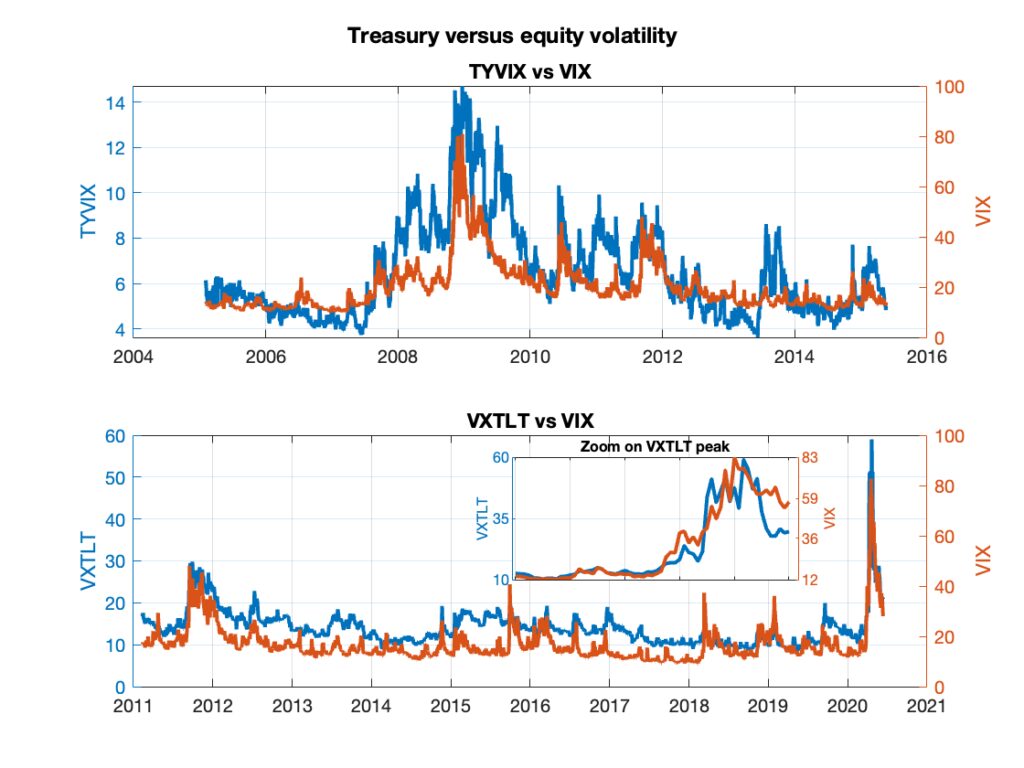 Figure 7: Equity and Treasury volatilities. Top panel: Cboe TYVIX and VIX Index. Bottom panel: Cboe VXTLT and VIX Index.
These indices provide a foundation for monitoring and interpreting shifts in macro-financial uncertainty. Today’s macro-financial landscape is especially sensitive to even marginal shifts in policy expectations, debt sustainability concerns, and liquidity regimes. In this environment, such volatility benchmarks are even more essential, offering market participants, policymakers, and risk managers with effective tools to monitor, hedge, or interpret the evolving uncertainty embedded in sovereign bond markets. Treasury volatility benchmarks systematically capture the market’s expectations of Treasury volatility, thereby embedding forward-looking assessments of monetary policy uncertainty, debt sustainability, liquidity conditions, and safe-haven demand—factors that are not adequately captured by swap-based volatility measures alone. For example, linking VXTLT dynamics to the entropy of Federal Reserve projections—such as the dispersion across FOMC members’ “dot plots”—could shed light on the degree of policymakers’ difference in beliefs versus uncertainty perceived by market participants.
The development of standardized Treasury volatility indices thus marked a natural, if long overdue, evolution in volatility analytics, extending their reach beyond equities and swap markets into the sovereign debt space. Such advances entailed several challenges. One key technical difficulty with swap-based volatility measures is that they are conceptually anchored to yield changes. Swaption markets, in particular, reference the underlying swap rate, framing the foundational notion of volatility in terms of absolute basis point movements—value fluctuations are interpreted through the lens of yield differentials. The methodology discussed so far (notably, Eq. [2]) adheres to the way the marketplace conceives volatility in this space. Treasury volatility, by contrast, may follow different conventions due to its price-based structure. The first attempt to systematically measure expected price volatility in the U.S. Treasury market came in 2013, when Cboe, in partnership with CME Group, launched the TYVIX Index (originally VXTYN) to options on 10-year Treasury note futures.There are several technical nuances worth noting. In the fixed income space, pricing price volatility might not always be model-free. Specific challenges arise from the choice of the market probability and numéraire, maturity mismatches (as options obviously have shorter maturities than the underlying government bond futures), and from the need to account for American-style corrections, due to the use of American rather than European options in the index construction. These issues are examined in detail in Mele and Obayashi (2015, Chapter 4), and the reader is referred to their Chapter 1 for a concise overview of their treatment, recommendation and proposals, including those adopted by Cboe.
The TYVIX index was the first public benchmark explicitly designed to quantify Treasury price volatility in real time. In 2014, CBOE Future Exchange introduced futures contracts referenced to TYVIX, providing the first standardized, exchange-traded instruments allowing investors to take positions directly on U.S. Treasury volatility. Despite its innovative design, the market adoption of TYVIX futures was limited, and the product was eventually discontinued. Furthermore, The TYVIX index is no longer actively disseminated, although remaining available via FRED. It was replaced by another index: in 2024, Cboe introduced a more scalable, liquid approach—a new generation of Treasury volatility indices. One is the Cboe VXTLT Index. Unlike TYVIX, VXTLT is based on options written on U.S. Treasury ETFs—specifically, the iShares 20+ Year Treasury Bond ETF (TLT)—covering more than 20 underlying U.S. Treasury ETFs. This design shift reflects the growing liquidity and accessibility of ETF-based derivatives relative to futures-based contracts in Treasury markets. As with TYVIX, the VXTLT index captures price volatility in Treasury markets. A related index is the VIXTLT index, which is yield-based (referred to as a basis point index): if the price volatility index is denoted by V, then VIXTLT is defined as 100×V/D, where D represents an estimate of the modified duration of the underlying ETF. Mele and Obayashi (2015, Chapter 4) develop yield-based formulations of this kind and also provide a model-free estimate of modified duration. Cboe currently maintains real-time measures of the index.
Beyond the U.S., global fixed income markets have also embraced sovereign volatility benchmarks. In 2015, S&P Dow Jones Indices, in partnership with the Tokyo Stock Exchange, introduced the S&P/JPX JGB VIX (in Japanese), providing the first standardized gauge of expected price volatility in Japanese Government Bonds (JGBs). The index effectively transposed the Treasury volatility architecture into the Japanese sovereign bond market, extending the reach of volatility-based analytics into one of the world’s largest public debt markets.
Corporate volatility
Yet there are additional spaces that could be explored through this new methodology. Notably, Mele and Obayashi (2015, Chapter 5) and Mele and Obayashi (2020) developed a framework for pricing variance swaps in the credit space, paving the way for the construction of credit volatility indices. In October 2023, simplified versions of this approach were implemented with the launch of a suite of Credit VIX indices. These indices provide forward-looking measures of expected volatility in North American and European credit markets, adapting the interest rate methodology (see Eq. [2]) to the credit space and offering estimates of anticipated fluctuations in credit spreads over a 30-day horizon. The Credit VIX indices are fed through options on credit default swap (CDS) indices, specifically S&P DJI’s CDX and iTraxx benchmarks, which are widely used in the credit derivatives market. Notably, the indices are calculated by aggregating prices of CDS index options through formula [2], based on a market numéraire known as Defaultable-PVBP (see Mele & Obayashi, 2015; 2020). These are simplified versions of the indices proposed by Mele and Obayashi (2015, Chapter 5) and Mele and Obayashi (2020), which address the complications arising from the use of exotic options as underlying instruments in the index design.
The indices provide a standardized gauge of credit market uncertainty, covering both investment-grade and high-yield credit segments, and support risk management strategies by offering new tools for investors tracking corporate credit volatility in North America and Europe. S&P currently maintains 12 indices: 1-month, 3-month and 6-month maturities for each of the following four categories:
- CDX/Cboe NA High Yield Volatility Index (VIXHY) (North America)
- CDX/Cboe NA Investment Grade Volatility Index (VIXIG) (North America)
- iTraxx/Cboe Europe Main Volatility Index (VIXIE) (Europe)
- iTraxx/Cboe Europe Crossover Volatility Index (VIXXO) (Europe)
Figures 8 and 9 illustrate the dynamics of North America credit volatility across both the High Yield and Investment Grade segments. Each figure also displays index-based confidence bands, constructed using the same procedure adopted for the bands shown in Figures 3 and 4 in the interest rate volatility case.
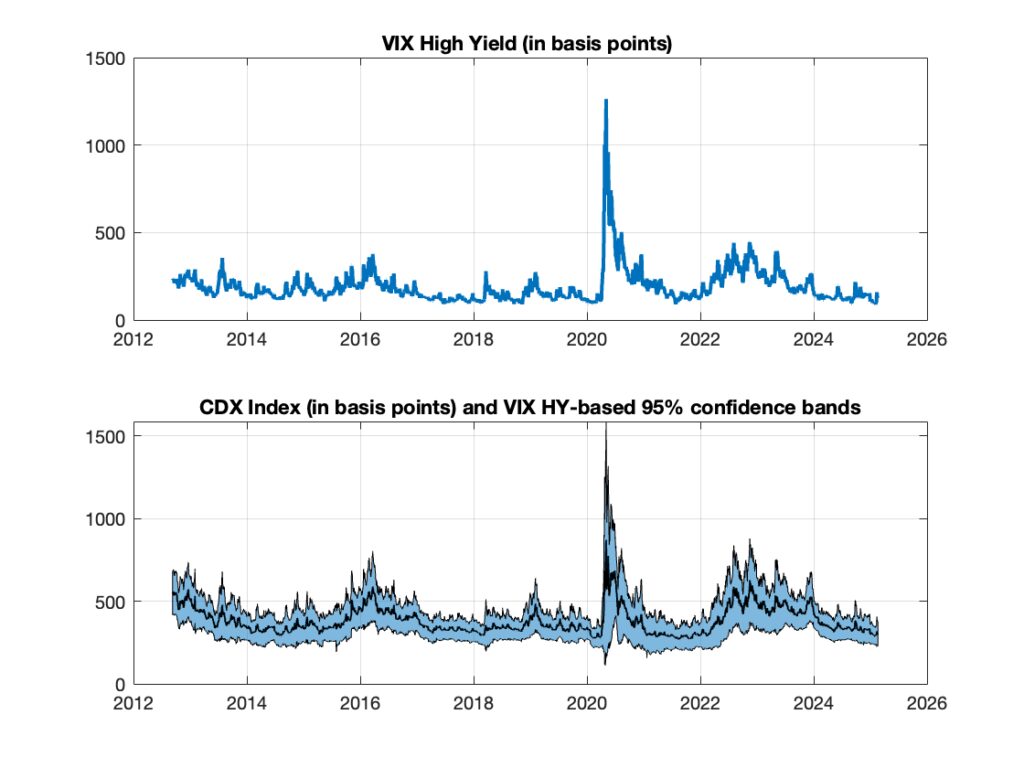 Figure 8: Credit volatility: CDX/Cboe NA High Yield one-month Volatility Index (VIXHY) (North America) (top panel) and index-based forward swap rate confidence bands (bottom panel).
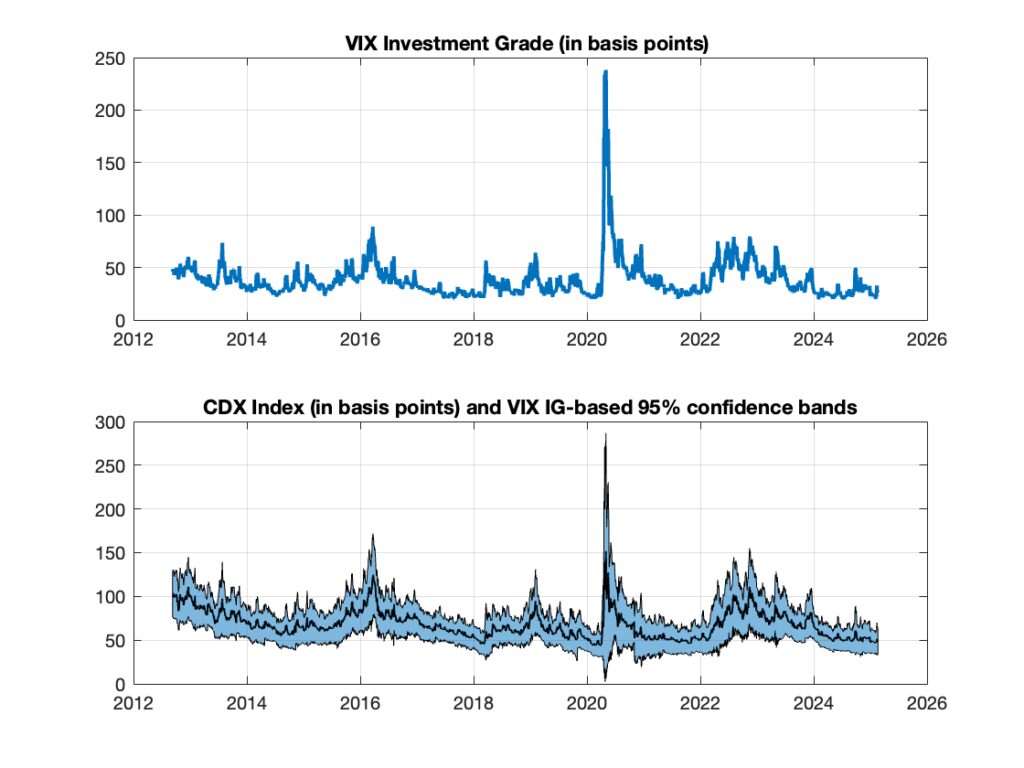 Figure 9: Credit volatility: CDX/Cboe NA Investment Grade one-month Volatility Index (VIXIG) (North America) (top panel) and index-based forward swap rate confidence bands (bottom panel).
Citations appearing on this page
Demeterfi, Kresimir, Emanuel Derman, Michael Kamal, and Joseph Zou (1999): “More Than You Ever Wanted to Know (But Less Than Can Be Said) About Volatility Swaps.” New York: Goldman Sachs, Quantitative Strategies Research Notes, March.
Distaso, Walter, Valentina Corradi and Antonio Mele (2013): “Macroeconomic Determinants of Stock Volatility and Volatility Premiums.” Journal of Monetary Economics 60, 203-220.
Distaso, Walter, Antonio Mele and Grigory Vilkov (2024): “Cross-Section without Factors: a String Model for Expected Returns.” Quantitative Finance 24, 693-718.
Mele, Antonio (2022): Financial Economics. Cambridge, MA, MIT Press.
Mele, Antonio and Yoshiki Obayashi (2011) “Methods and Systems for Creating an Interest Rate Swap Volatility Index and Trading Derivative Products Based Thereon.” United States Patent No.: US 8,510,210 B1.
Mele, Antonio and Yoshiki Obayashi (2015): The Price of Fixed Income Market Volatility. Springer: Springer Series in Finance, New York.
Mele, Antonio, Yoshiki Obayashi and Catherine Shalen (2015): “Rate Fears Gauges and the Dynamics of Fixed Income and Equity Volatilities.” Journal of Banking and Finance 52, 256-265.
Mele, Antonio and Yoshiki Obayashi (2020): “Credit Volatility Indexes.” Swiss Finance Institute Research Paper Series No. 20-88.
Trolle, Anders B. and Eduardo S. Schwartz (2014): “The Swaption Cube.” Review of Financial Studies 27, 2307-2353.
Walras, Léon (1874): Éléments d’économie politique pure, ou théorie de la richesse sociale. Lausanne: Corbaz & Cie. English translation: Elements of Pure Economics, Homewood, Il.: R.D. Irwin (1954).
Further information, resources, and external links
The following links refer to research conducted primarily during the 2010s, focusing on volatility in interest rate and credit risk markets.